
Illustration
A collection of infographics, icons, and map illustrations from a variety of live projects, created to provide clarity and ease of use for consumers in property, retail, tech and Media.
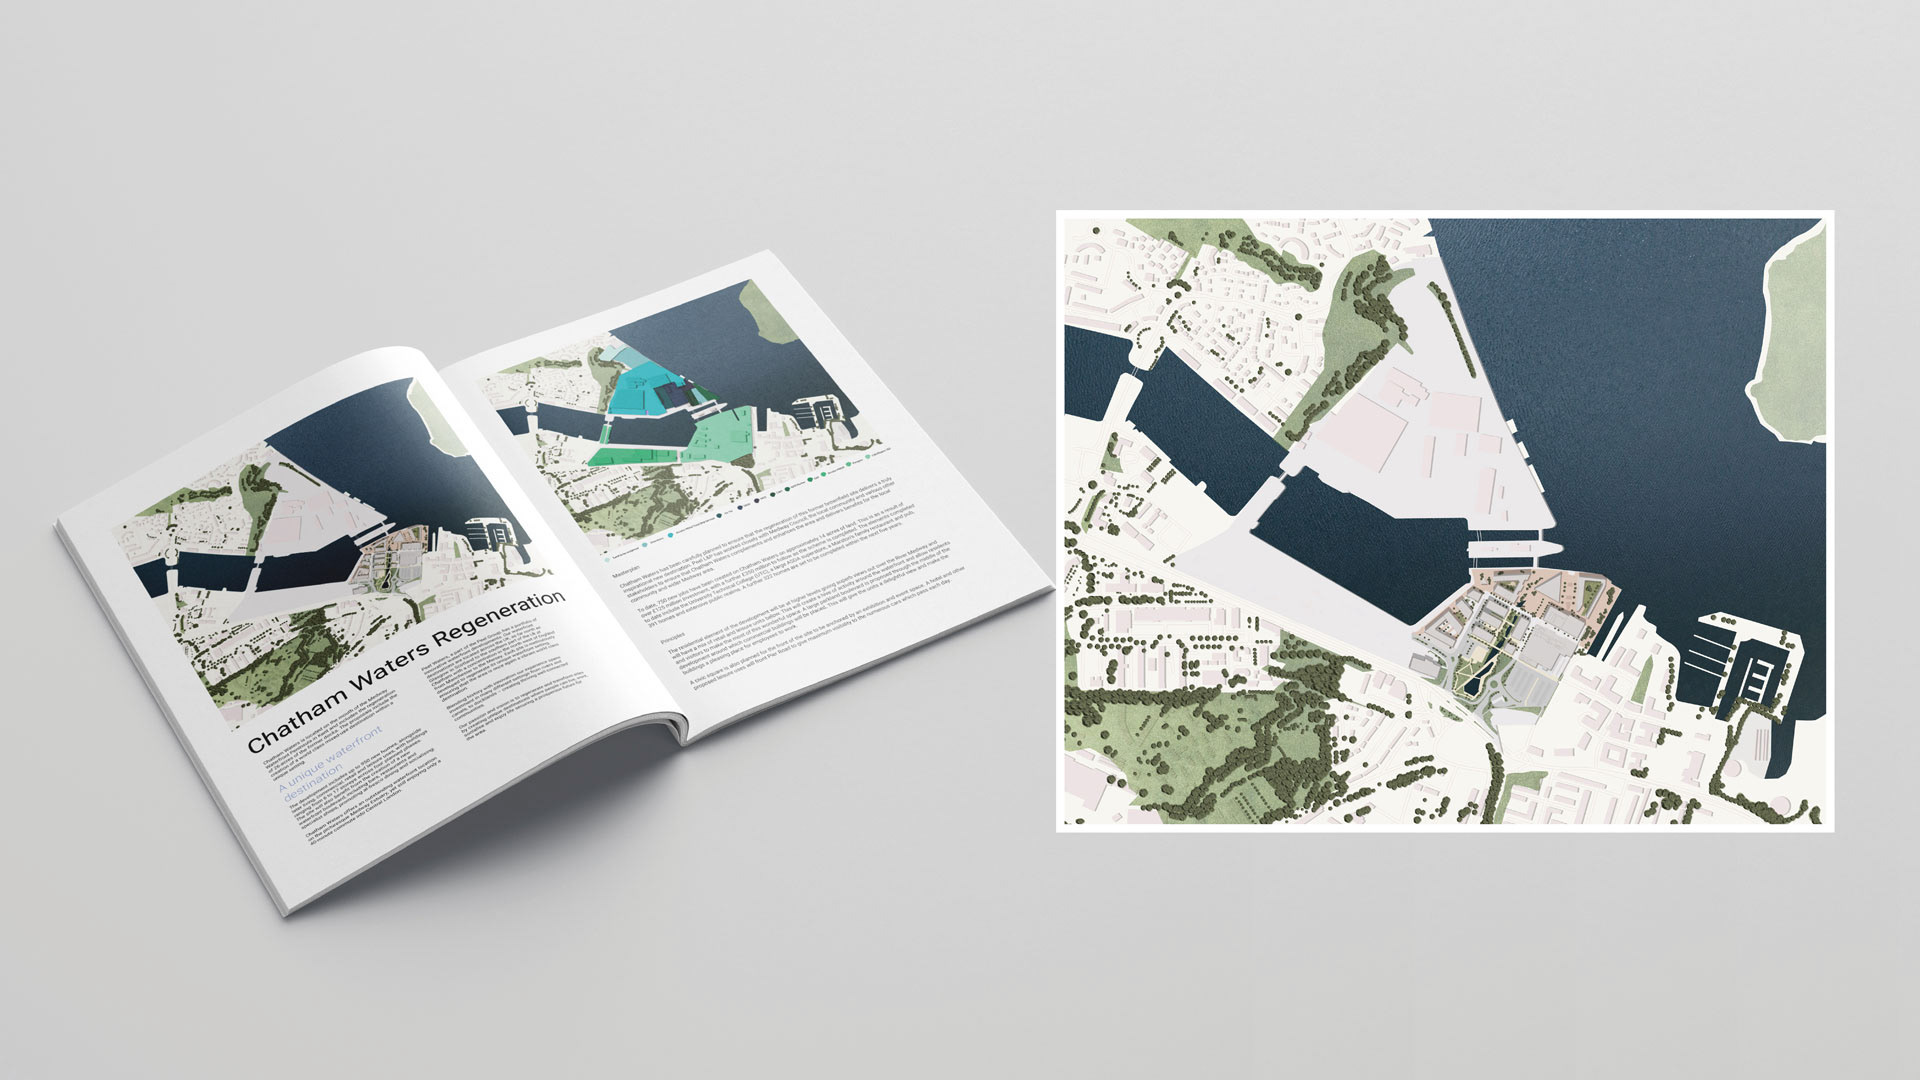
Designed a map for Chatham Waters Regeneration Project to clearly distinguish residential and commercial zones, improving legibility for marketing and stakeholder communication. This is also used on their website.
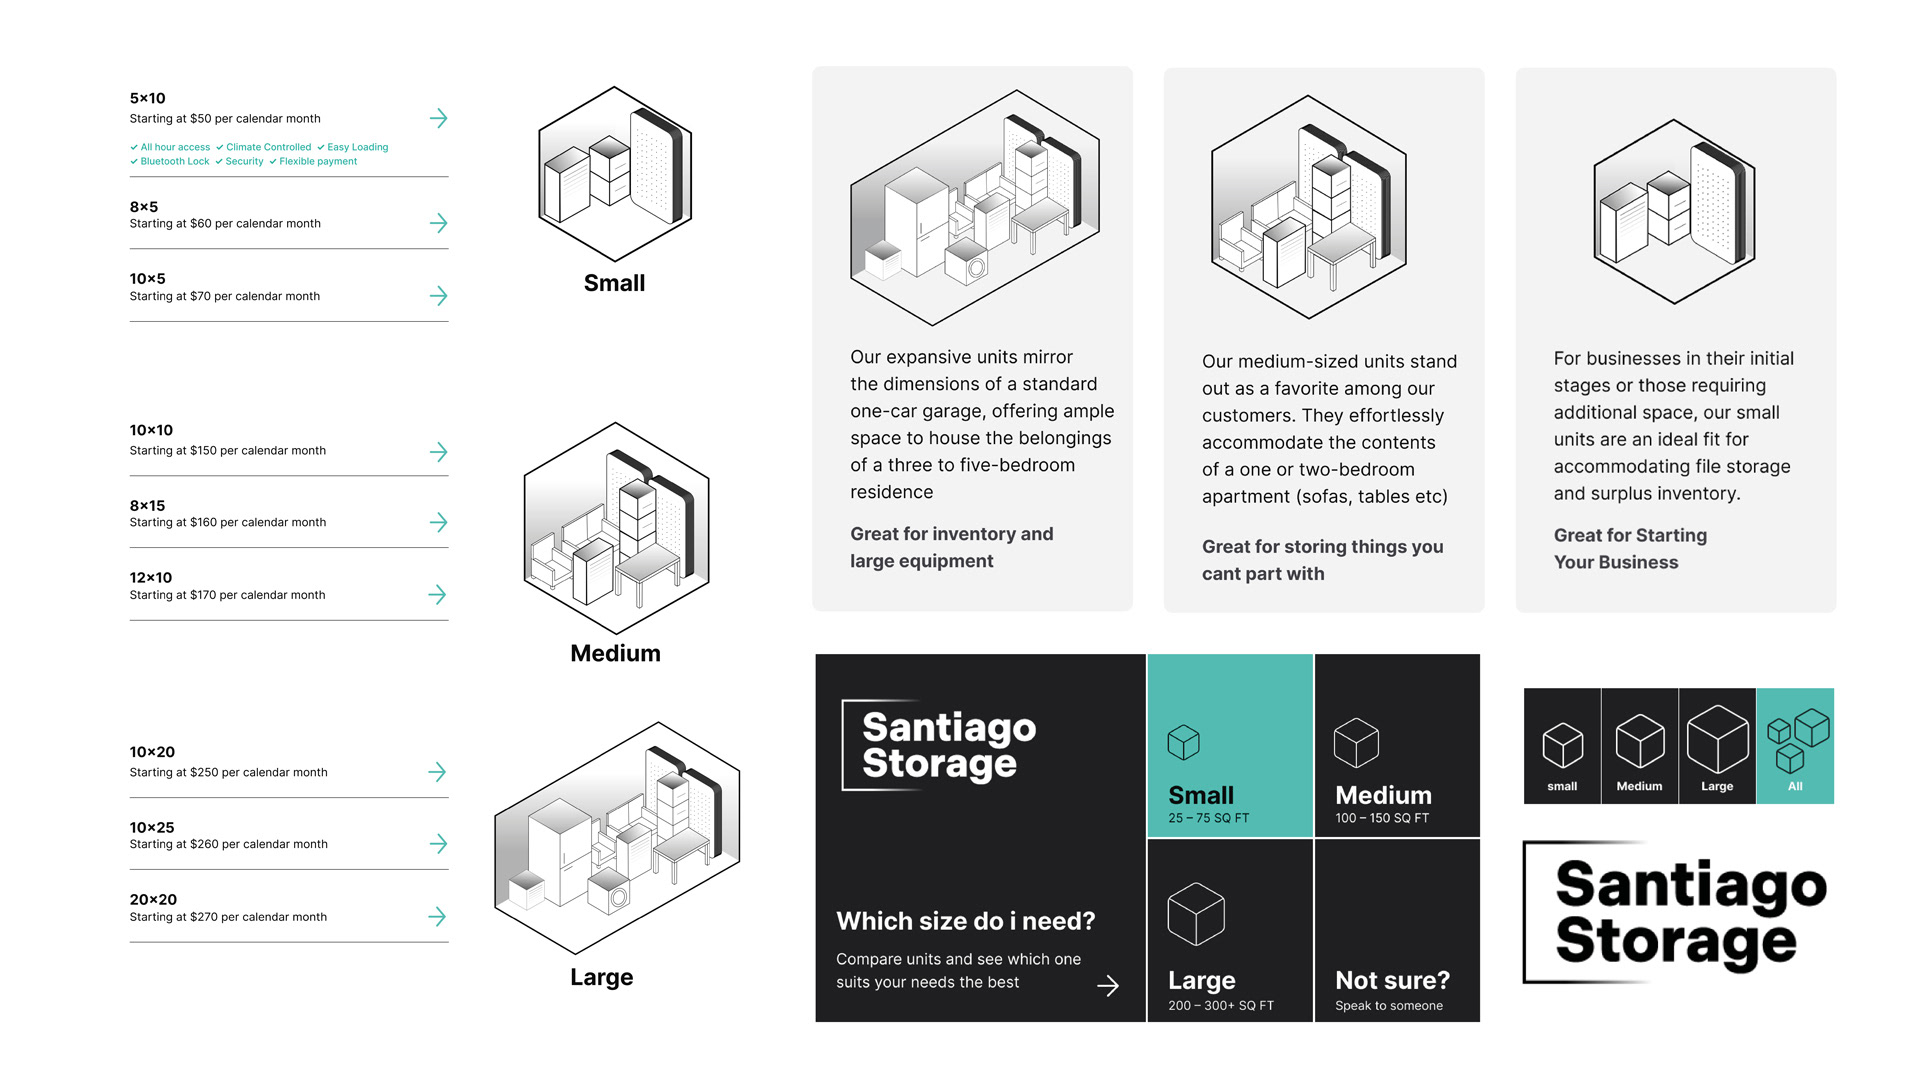
Simplified, easy-to-understand size illustrations to support customer decision-making during the booking process on a website catering to self -storage consumers.
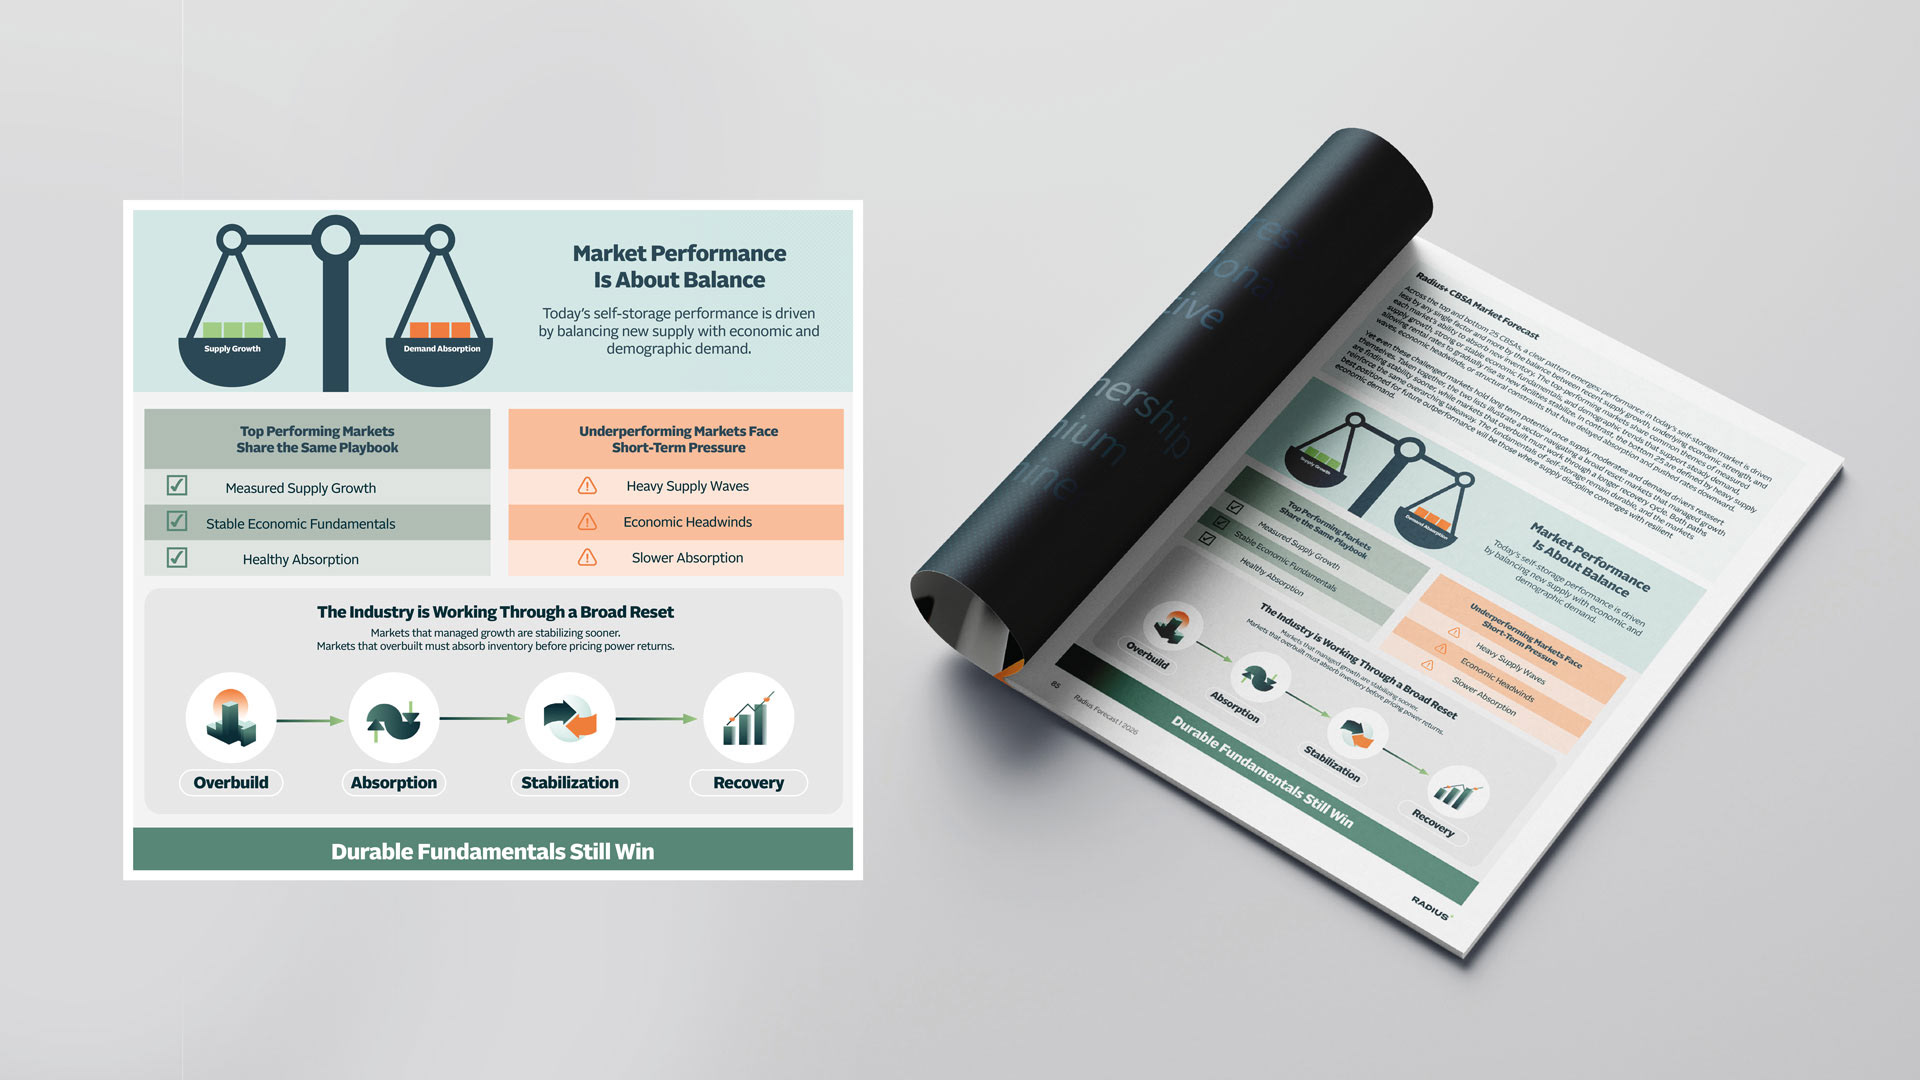
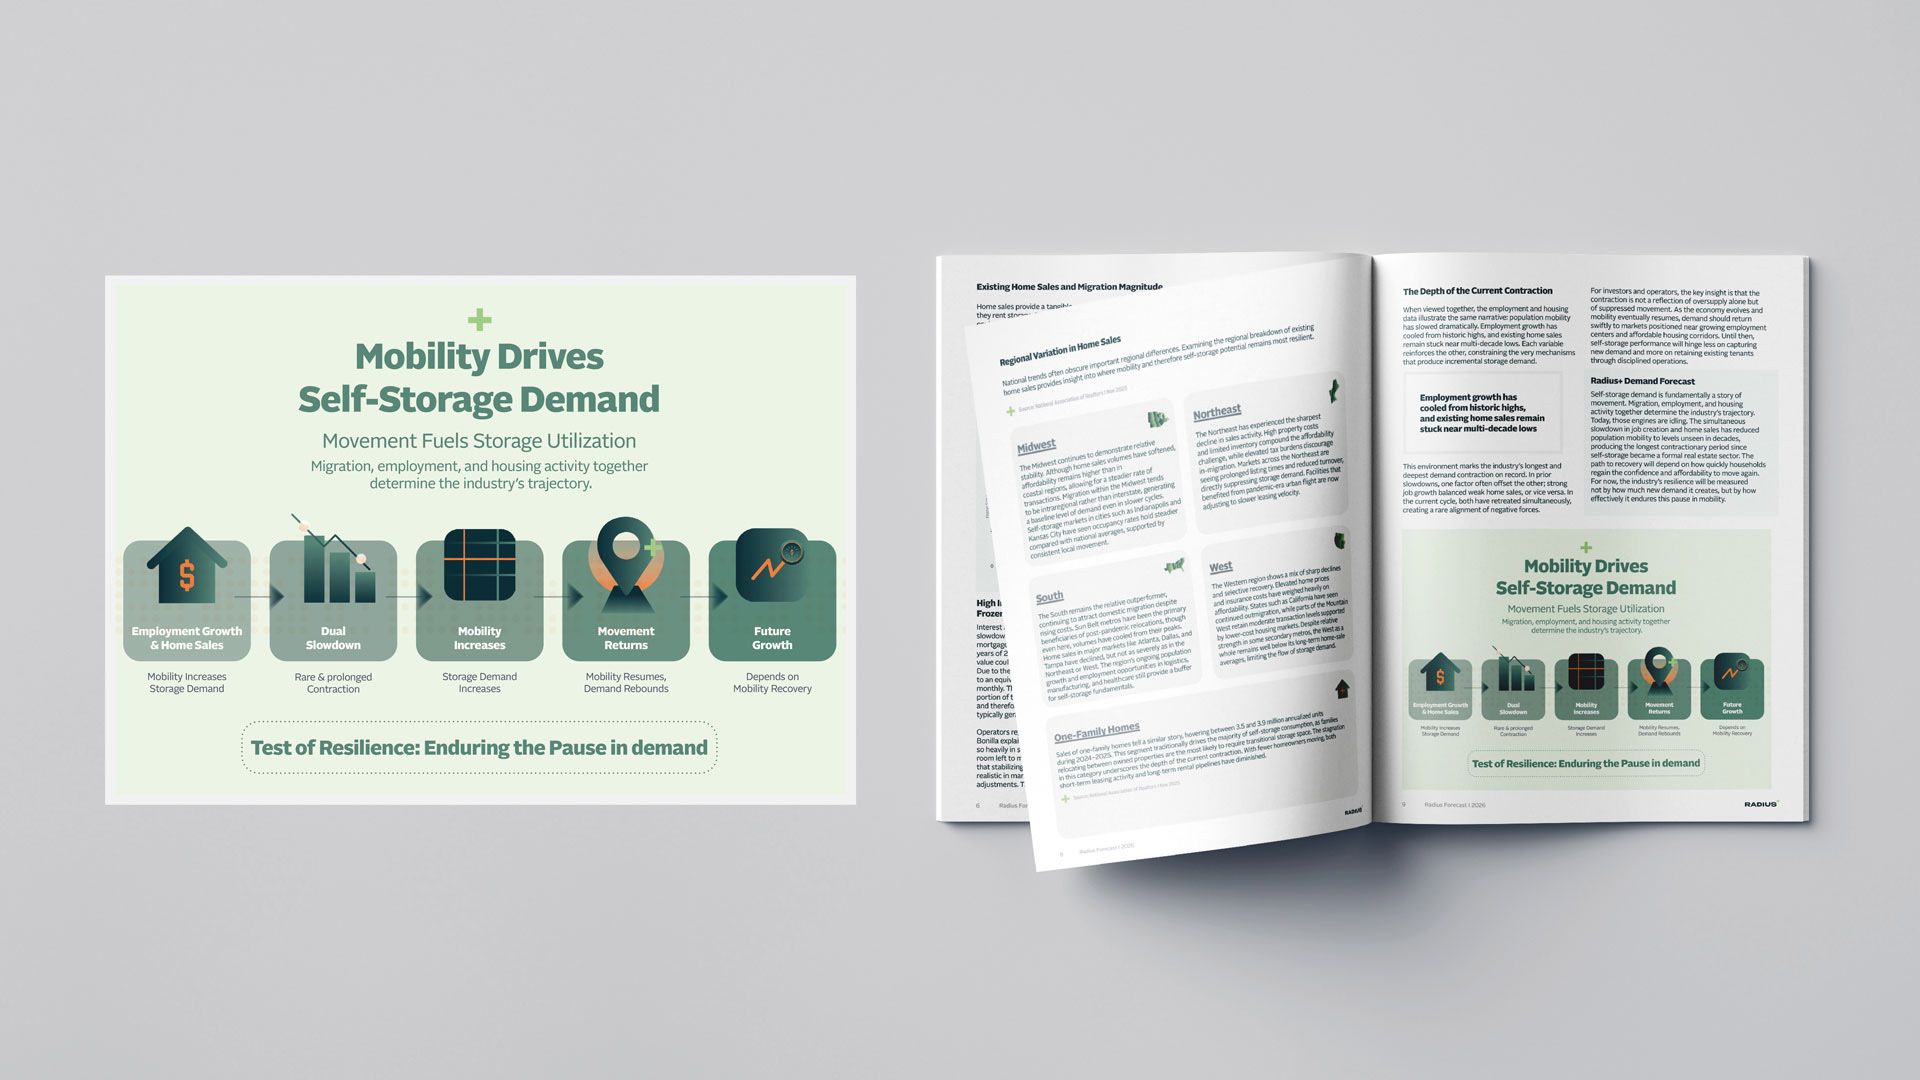
Data-led infographics to translate complex performance metrics into structured, accessible visual narratives for the companies 90+ page annual report.
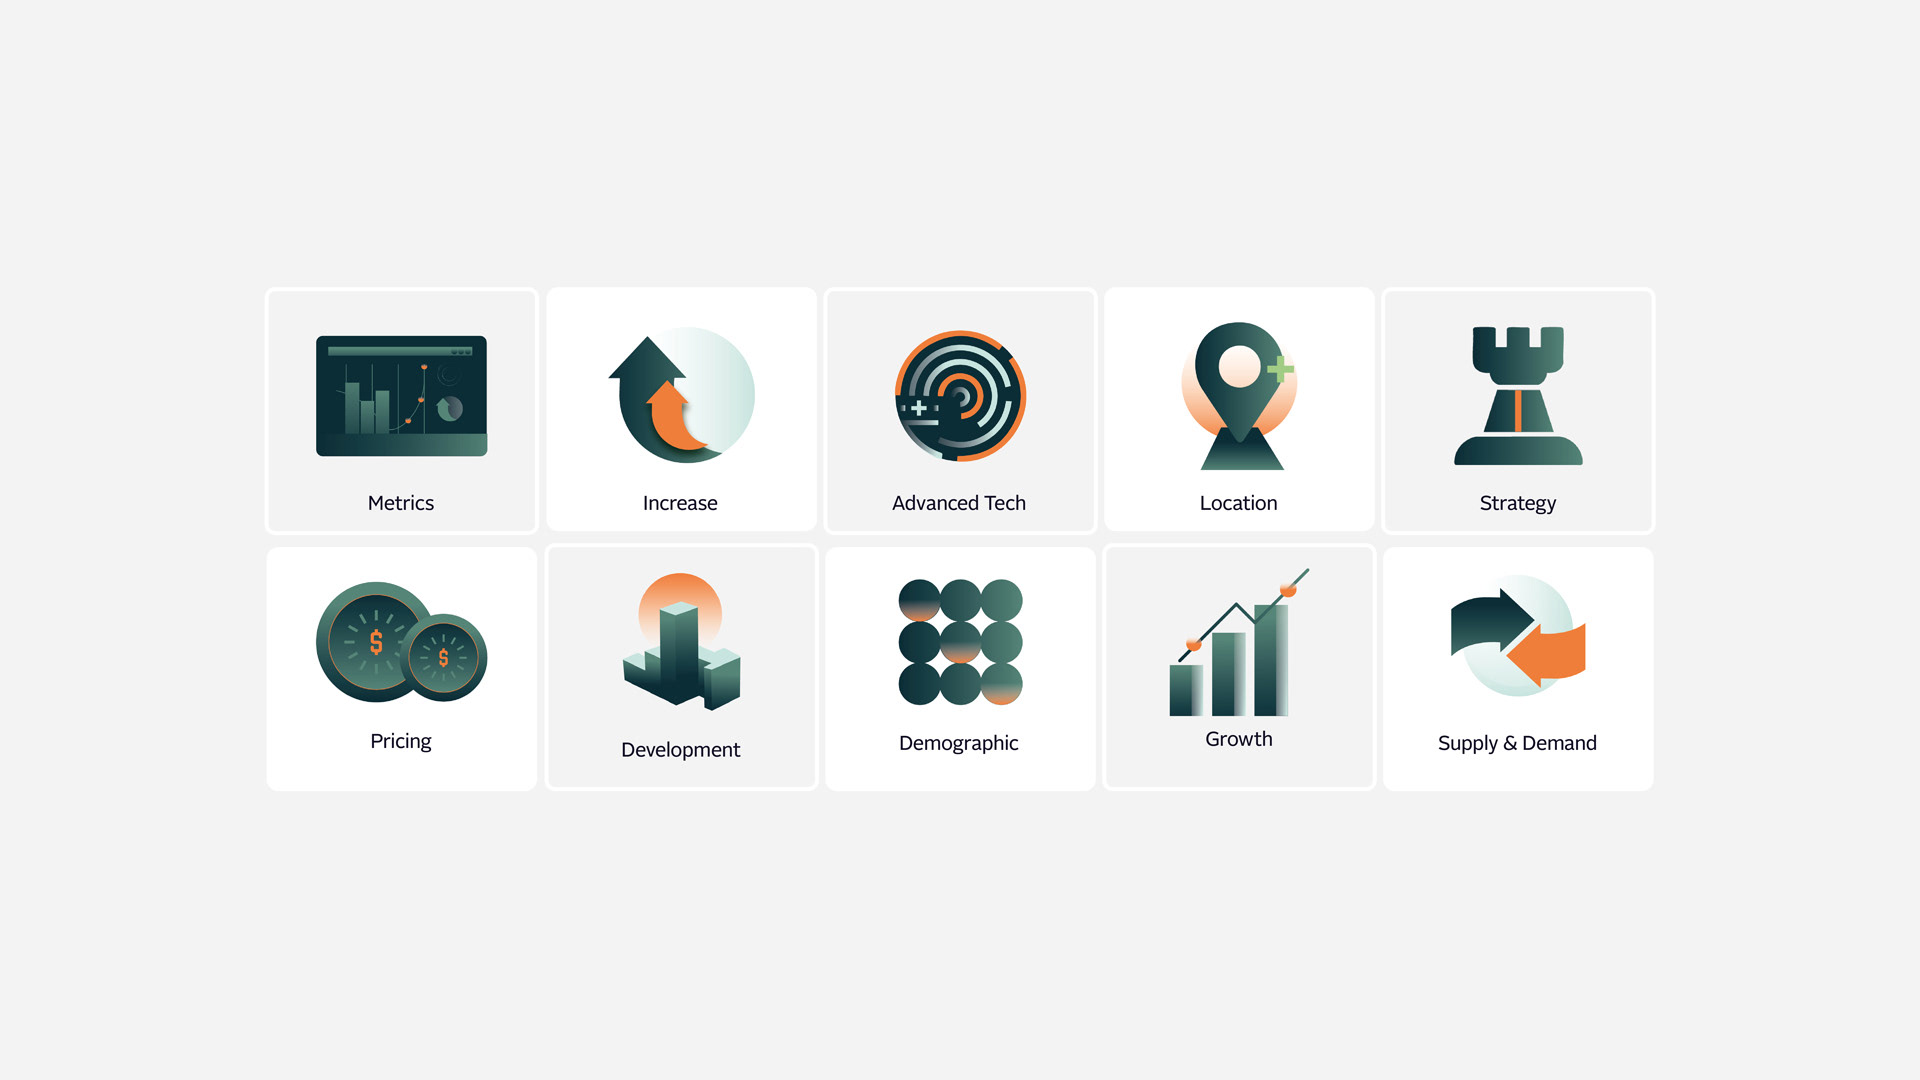
Developed a scalable icon system to support product UI, marketing pages, and brand consistency for an Saas product
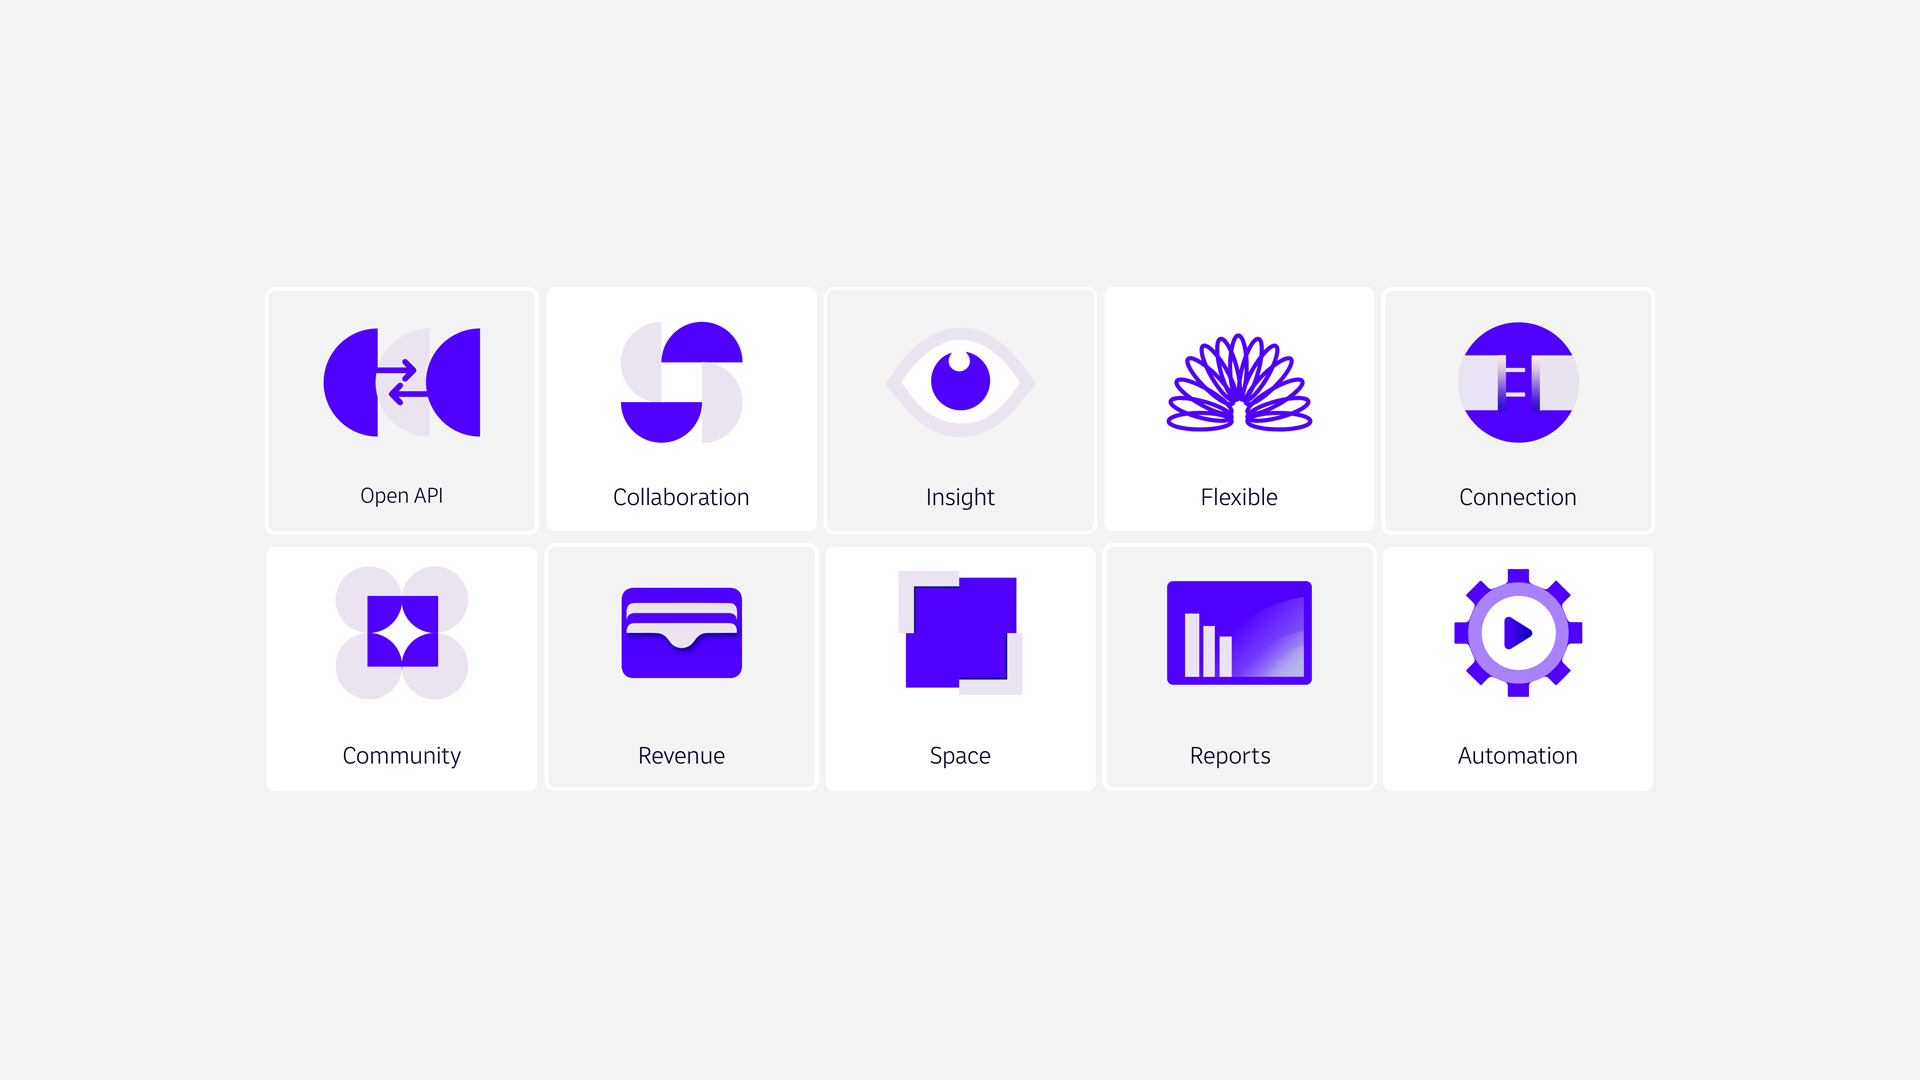
Developed a scalable icon system to enhance the marketing materials and social posts for an Saas community product.
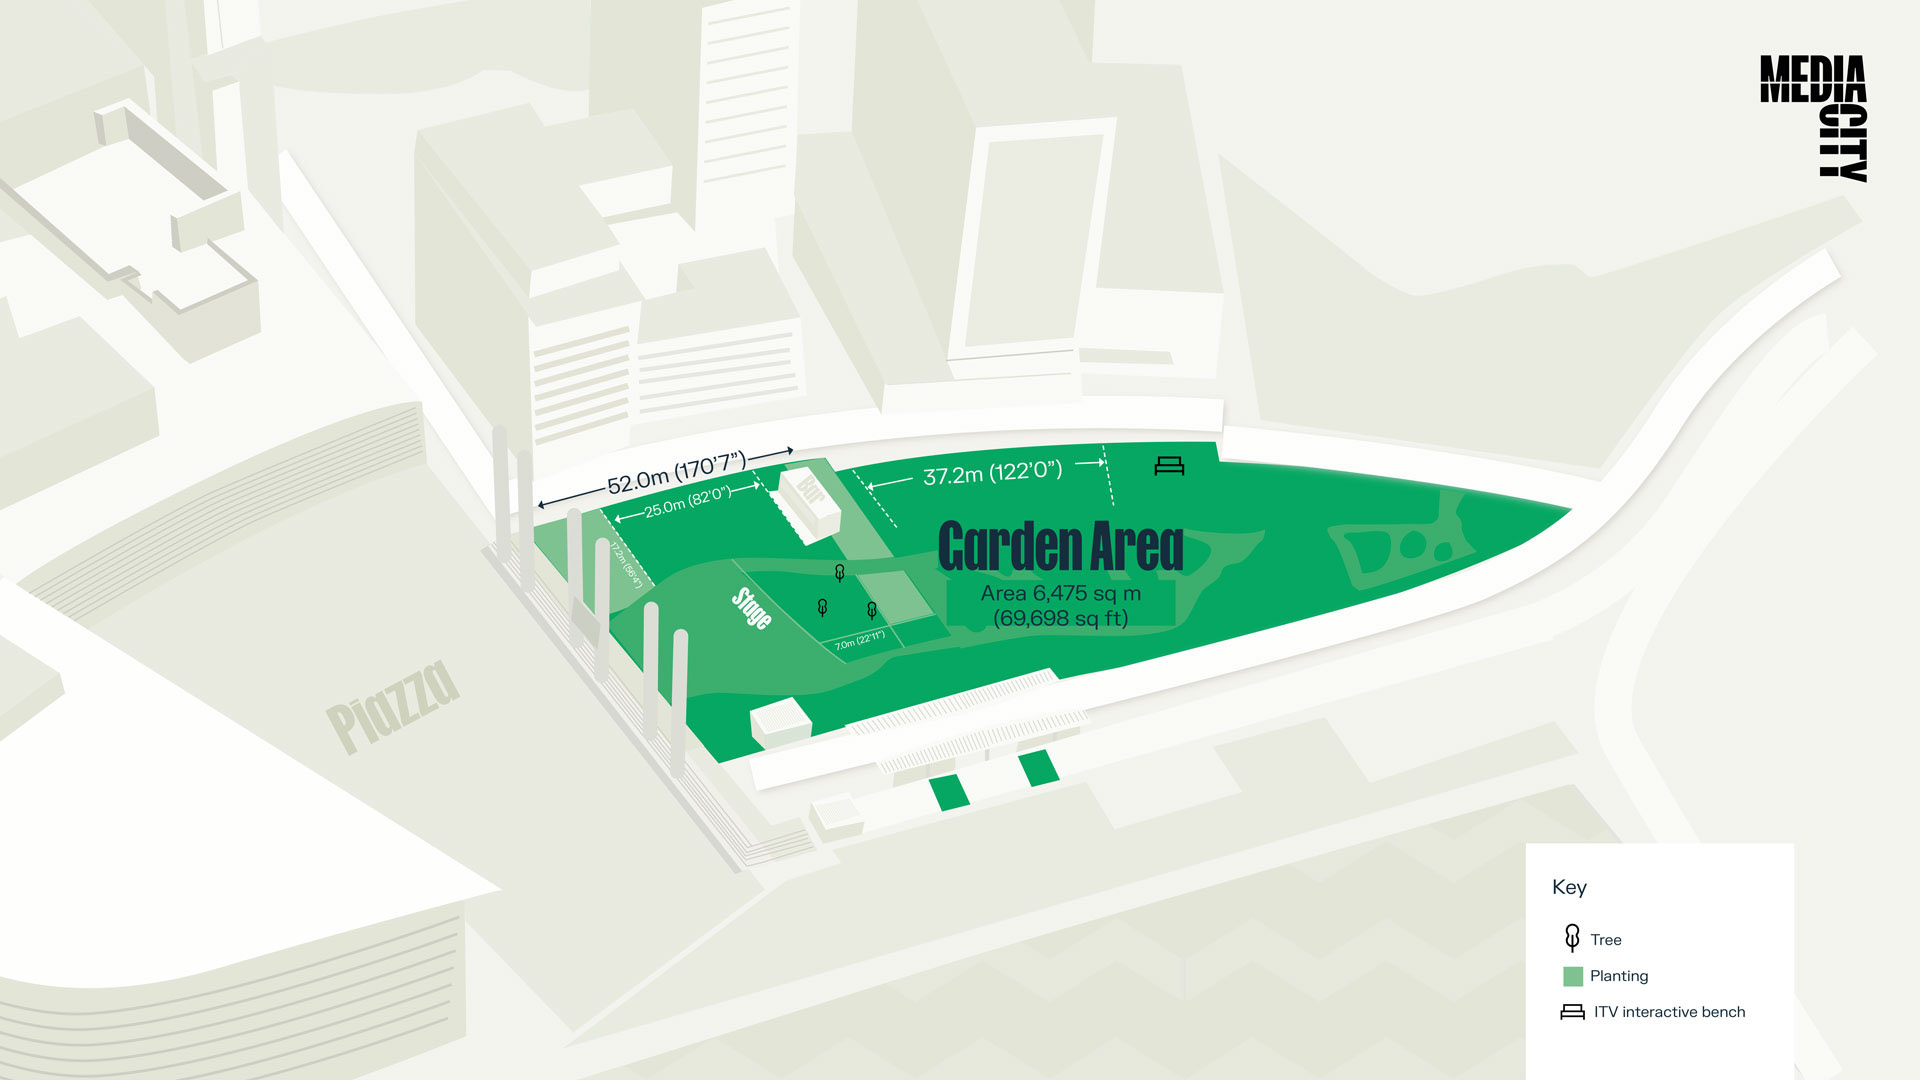
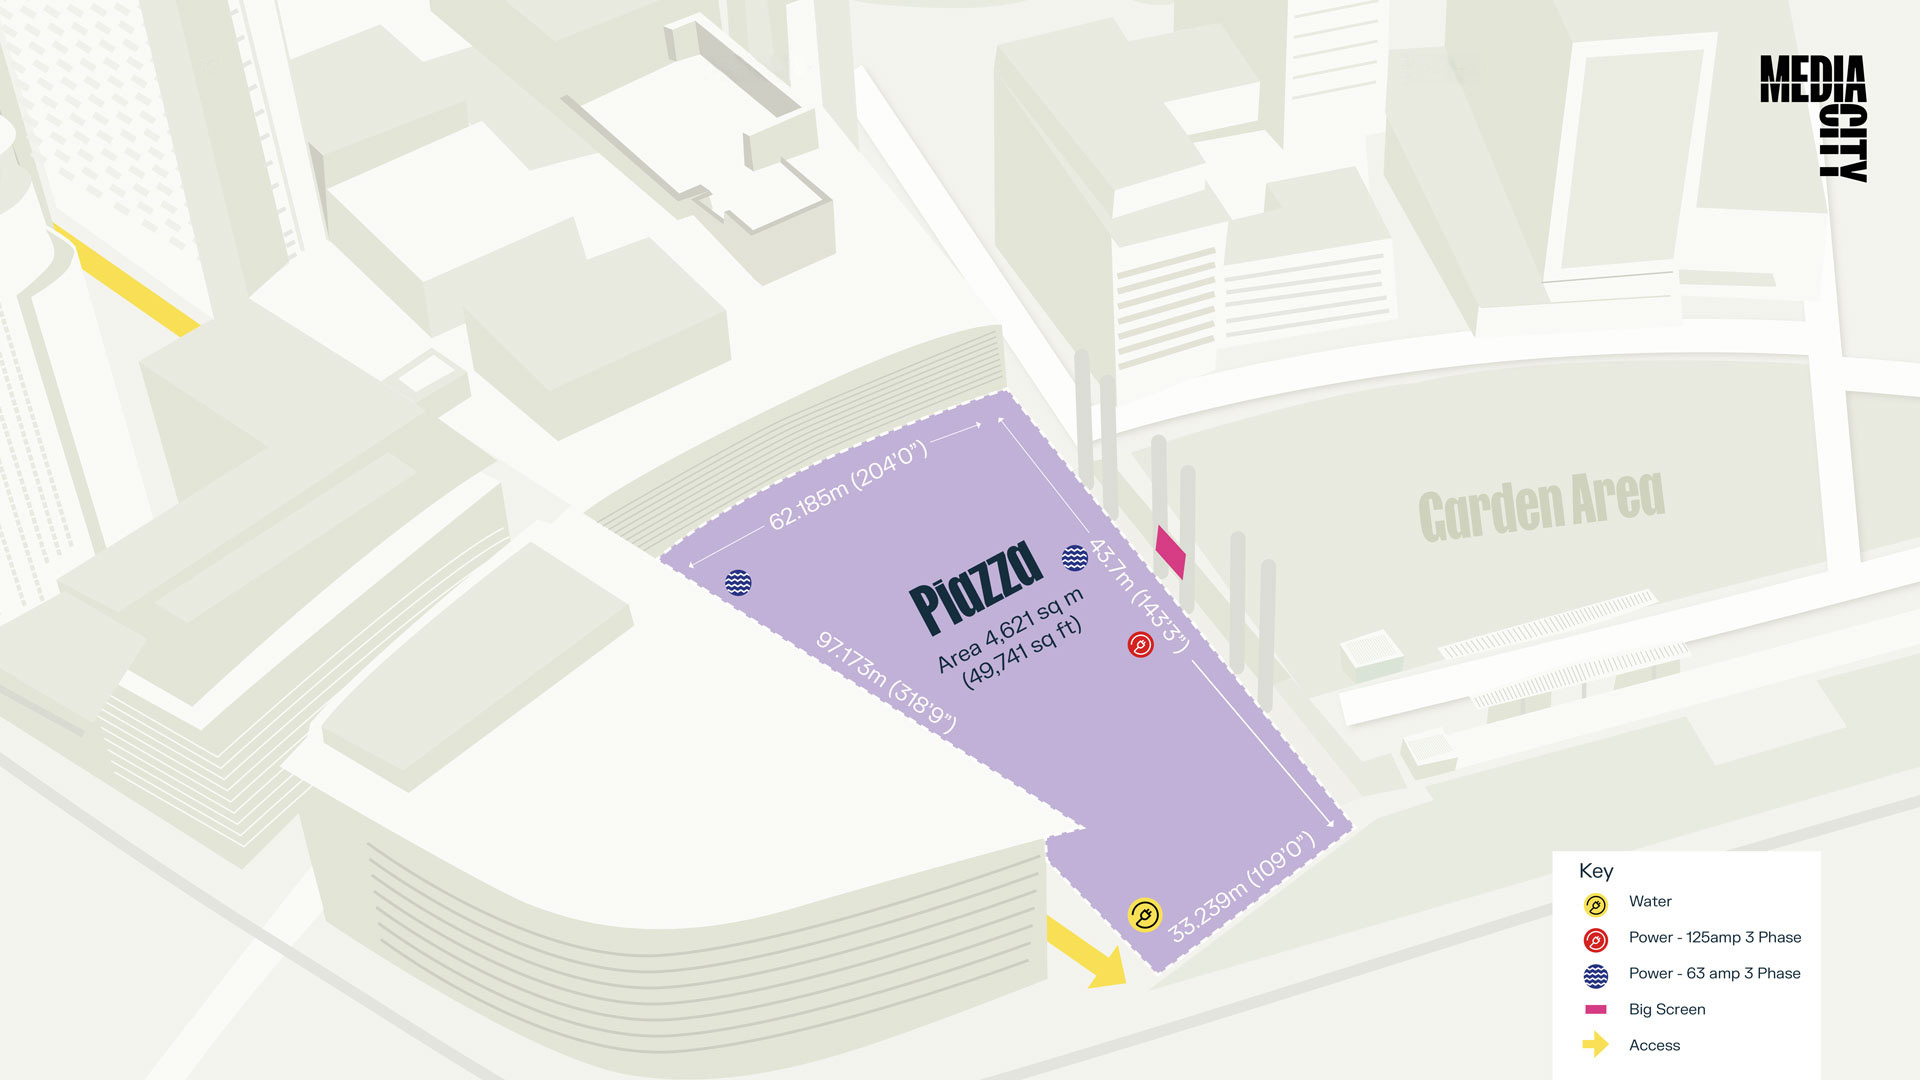
Illustrated location map to support advertiser pitches, clearly defining placement opportunities within MediaCity.


Illustrated and animated a bespoke icon set for the Liverpool Waters website, reinforcing brand consistency and improving offering clarity.